Automated analyses of elderly home care data
Project details
Year: 2025
Client: Monaco Directorate of Health
Objectives:
The project aimed to consolidate nearly 20 years of historical data collected by the Monaco Gerontology Coordination Center (CCGM) to analyze longitudinal trends and predict autonomy loss, while establishing an automated system for continuous monitoring of the programme.
Deliverables:
- Consolidated database
- Comprehensive data analysis report
- Monthly monitoring report
- R-Shiny application for automated update of deliverables
Performed activities
The Monaco Gerontology Coordination Center CCGM , created in 2005, supports the prevention of autonomy loss in elderly people. It monitors 800 people through standardized at-home gerontological assessments. Nearly 3 500 people have benefited from the programme since 2006. The resulting longitudinal data with around 13 000 standardized evaluations constitutes a unique resource for analyzing the health needs and trajectories of an elderly population.
Sigia was contracted to consolidate and analyze this data, describe the programme activity, document changes in the characteristics and pathways of the monitored population, and develop a predictive indicator of autonomy loss.
Using the R statistical software, two outputs can now be automatically produced by the CCGM team:
- A detailed data analysis report in HTML format providing 76 tables and 35 figures, each of them being easily retrieved by the user in Excel or PNG format.
- A monitoring document in Word format providing 9 tables and 6 figures to monitor activities and results for the ongoing year.
To increase the user-friendliness of the automated process, all R-scripts were grouped in a dedicated R-library and a R-Shiny application was developed to allow users to easily import the required data and export the final outputs (figure 1).
A multivariate survival analysis model with repeated events was fitted to provide a risk score of autonomy loss. The capacity of this score to correctly predict autonomy loss was assessed on a subsample of the population not used to fit the multivariate model (figure 2).
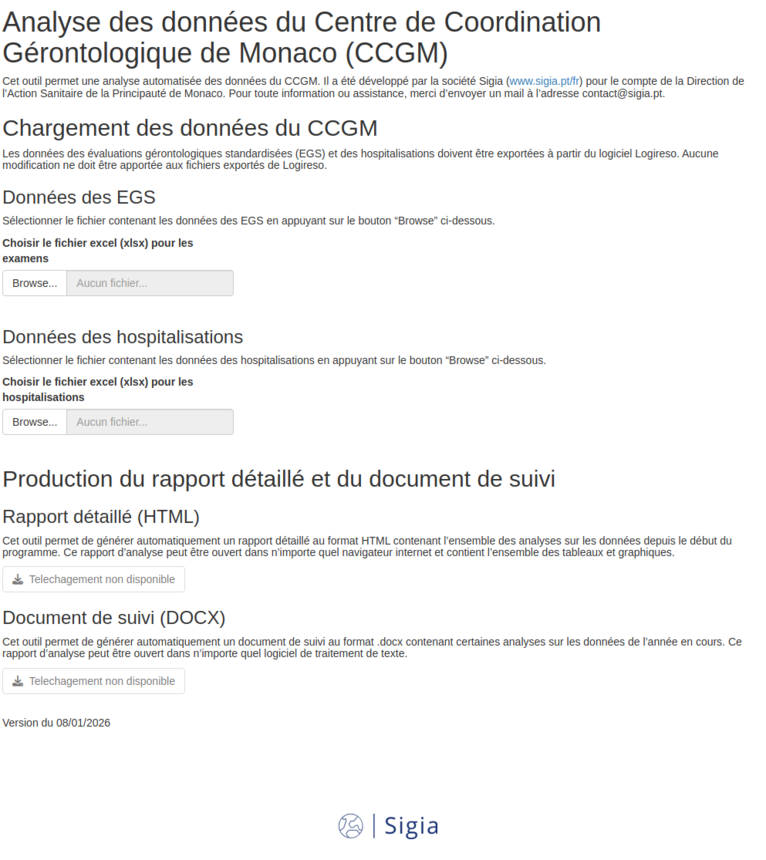
Figure 1. Tool for automated updates of analyses
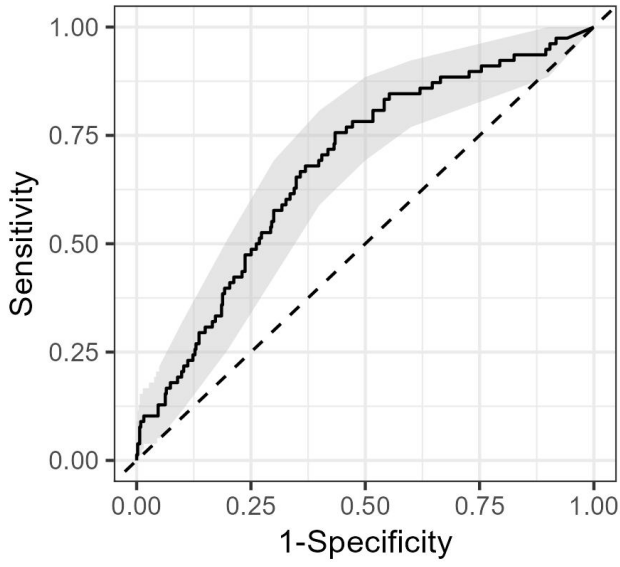
Figure 2. ROC curve of the risk score for autonomy loss